7 minute read.Crossref & the Art of Cartography: an Open Map for Scholarly Communications
In the 2015 Crossref Annual Meeting, I introduced a metaphor for the work that we do at Crossref. I re-present it here for broader discussion as this narrative continues to play a guiding role in the development of products and services this year.
 At Crossref, we make research outputs easy to find, cite, link, and assess through DOIs. Publishers register their publications and deposit metadata through a variety of channels (XML, CSV, PDF, manual entry), which we process and transform into Crossref XML for inclusion into our corpus. This data infrastructure which makes possible scholarly communications without restrictions on publisher, subject area, geography, etc. is far more than a reference list, index or directory.
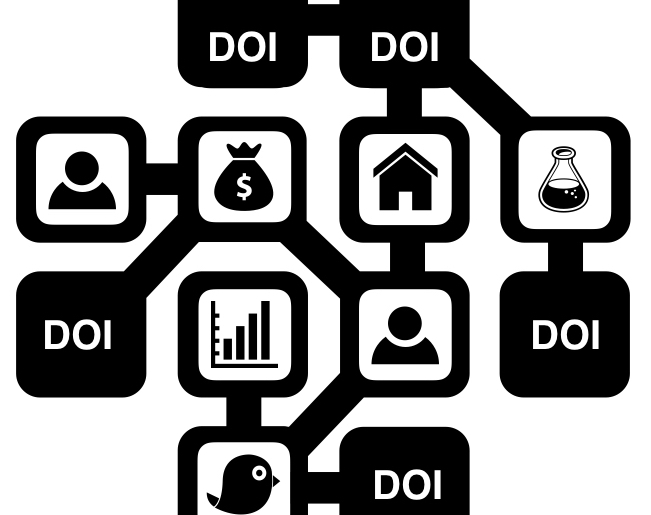
If research builds on what came before, one could claim that the process of knowledge production is partly the story of the very relationships between results disseminated (i.e., publications). So let’s consider each publication as a node in a graph where  each has a coordinate and is connected by its citations to other publications (as well those that cite it). Additionally, each is associated with a set of people and places, along with a whole host of elements involved in the research and dissemination process.
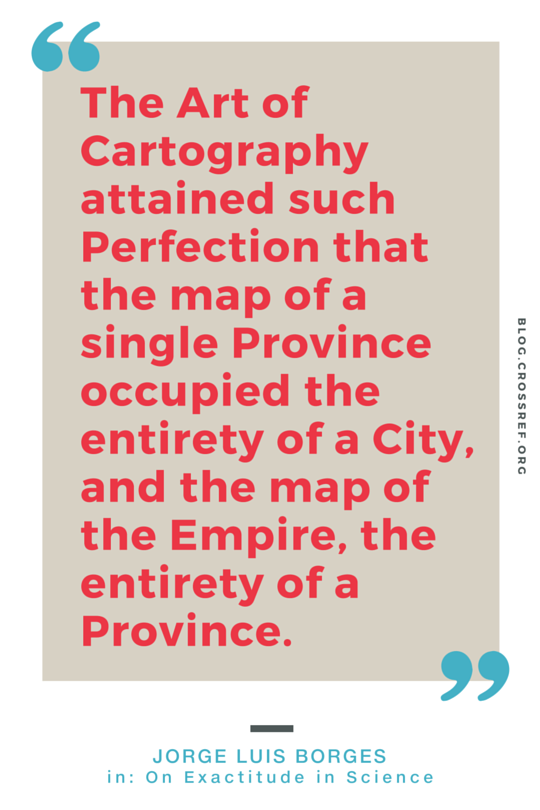
But take a wider berth, and we begin to capture relationships between all such contributing agents and objects involved in the research process. Here we find an array of entities belonging to the scholarly graph, including different types of research artifacts, publisher and journal, funders, ORCIDs, peer reviews, publication status updates (corrections, retractions, etc.), citations, license information, additional URLs (machine destinations, hosting platforms, etc.), underlying data, software and protocols, materials, discussions and blog posts, recommendations, reference work mentions, etc. The entities on the graph multiply at an even higher rate as researchers share more outputs across more channels. And over time, the graph expands exponentially, producing a webbing that is far more dense and far more vast than we can currently imagine. Perhaps even to the point we realize Borges’ story where a cartographer builds a map so large it replicates the territory itself (On Exactitude in Science)!
From graph to cartography
At the heart of Borges’s poignant story is the map. Crossref’s graph of scholarly communications could be seen in the same light. It has a representational aspect, which is not purely abstract and can be visualized. Here, a map becomes an incredibly potent metaphor. Each link enabled by publisher-deposited metadata is a new street, bridge, or highway that takes us to a particular place (i.e., entity) of interest. These roads lead to articles, researchers, funders, institutions, etc., and in doing so, make them discoverable. They tell a story about the roles of each in the broader research in the landscape dotted with a plethora of places.
The scholarly web has a growing corpus of more than 78 million publications at this very moment registered with Crossref. On average ten to fifteen thousand new objects appear every day. Maps are all the more essential for getting around in a bewildering environment of new and unfamiliar places, even for known ones in areas of exploding growth. They are critical for orienteering, discovering relationships, identifying sets of associated objects, naming new neighborhoods that emerge (i.e., new research specialties), etc. And if each connection on the map is seen as an event, maps can also represent micro-narratives about the research process and the agents involved. A multi-dimensional map containing all these entities, which serves as an evolving representation of spacetime that is constantly updated and always available, would finally begin to depict the process of scholarly activity as a dynamic, evolving, almost living system.
An open map for scholarly communication
Crossref builds such a scholarly map of the research enterprise and makes it openly available for the entire research ecosystem. Call this a meta map or, more recently, call it metastructure. No matter what name it goes by we call it infrastructure at Crossref.
Crossref’s open map for scholarly communications is a core part of the open information infrastructure for scholarly research. Crossref map data are open, portable, as well as licensed and provisioned for maximum reuse to serve the whole community. This open resource has two entrances: one for humans, another for machines. The Crossref REST API enables machines to traverse this environment and mine it in equal measure to the humans behind them. It is configured so that a robot can learn, a phone can access, and platforms can be built.
OpenStreetMap and Google Maps, both widely used and mature infrastructure maps, are instructive examples when we consider a map of this kind for scholarly communications. Map data can be represented in unlimited ways, depending on any variety of needs and users. Third parties can add content via interactive layers that tell different stories such as health expenditure by country based on GDP and coral reefs at risk. They have a broad base of users across business models from philanthropic services aimed at disaster relief (Refugeemaps.eu) to commercial entities providing drivers with locations on open parking spaces (AppyParking on Google Map, PocketParker on OpenStreetMap). They power platforms and services that build maps for others (MapQuest, MapBox). They have applications far beyond the business of maps. For example, Place picker is a Google Maps widget that supports easy auto-complete the entry of any place or location on a mobile app where typing is a chore. And as far use cases close to home, the two have served as raw data for academic research (ex: workflow for generating multi-agent traffic simulation scenarios, automatic classification of GPS trajectories for transportation modes, etc.).
In kind, the Crossref infrastructure map also supports: the development of any variety of new maps which re-present the data, the makers of map platforms that power the research enterprise, tools that use map data, as well as academic research (bibliometrics). We extract slices of data of common interest from the map and add them as additional layers by which anyone can access and create applications on or across these bands of data:
- Contributors (authors, editors, reviewers)
- Funding information (funding body, grant number)
- Trial & study information (clinical trials registry number, registered report, replication study)
- Publication history (versions, updates, revisions, corrections, retractions, dates received/accepted/published)
- Peer review (status, type, reviews)
- Access indicators (publication license for text & data mining, machine mining URLs)
- Resources & associated research artifacts (preprints, figures & tables, datasets, software, protocols, research resource IDs)
- Activity surrounding the publication (peer reviews, comments & discussions, bookmarks, social shares, recommendations).
Today, the map powers a host of public and commercial organisations alike for a wide range of scholarly and non-scholarly purposes:
- Publishers
- Funders
- Research institutions
- Archives & repositories
- Research councils
- Data centres
- Professional networks
- Patent offices
- Registration Agencies
| <td style="border: 1px solid #ffffff;">
<ul>
<li>
<span >Indexing services</span>
</li>
<li>
<span >Publishing vendors</span>
</li>
<li>
<span >Peer review systems</span>
</li>
<li>
<span >Reference manager systems</span>
</li>
<li>
<span >Lab & diagnostics suppliers</span>
</li>
<li>
<span >Info management systems</span>
</li>
<li>
<span >Educational tools</span>
</li>
<li>
<span >Data analytics systems</span>
</li>
<li>
<span >Literature discovery services</span>
</li>
</ul>
</td>
We will follow up this post to highlight a cross-section of these consumers in the Crossref map ecosystem and elaborate on what & how they have built from our data. An infrastructure map offers endless potential to third parties across publishers, funders, research institutions, and vendors working to serve the scholarly research enterprise.
The art of cartography
In the Crossref Product Management team, we have ambitious plans for map enhancements this year. They focus on expanding information density and ease of access to the data. In the former case, we will introduce a new class of locations where activity surrounding the publications are occurring when we launch the DOI Event Tracker. We will also initiate an extensive publisher campaign to achieve full metadata deposit completeness across our membership. No one can keep pace with the sheer volume of research activity happening online nor wander the Lonely Web of research alone. The more metadata publishers provide for a publication, the more roads lead to its map location. After all, discoverability is closely associated with connectedness on a map. And finally, in the latter case, we will refresh and enhance the user interface to make it more powerful for humans to traverse the ever-changing landscape (as easily as the REST API enables machines!).
I gratefully acknowledge the feedback received from the following who served as generous and insightful sounding boards: Virginia Barbour, Theo Bloom, Martin Eve, Daniel S. Katz, Amye Kenall, Catriona MacCullum, Cameron Neylon, Mark Patterson, Kristen Ratan, Carly Strasser, and Kaitlin Thaney.